To continue exploring our datasets, return to statistics.gov.scot
Our users often tell us that they like to be able to visualise trends in datasets over time. For example, you might want to look at how the proportion of energy from renewable sources has changed through time.
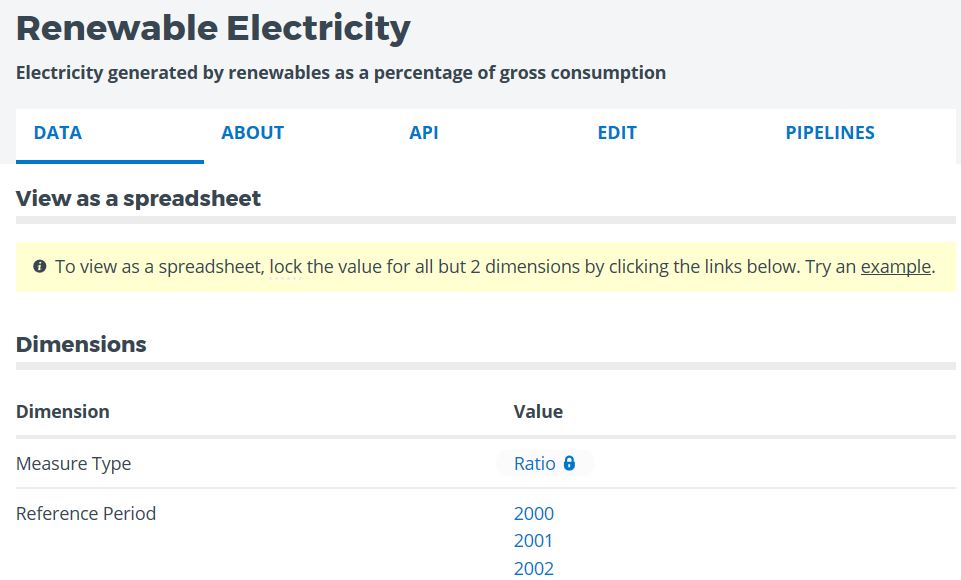
To begin, search for ‘electricity’ in the search tab, and select the Renewable Electricity dataset.
For the Renewable Electricity dataset, the contents are quite simple – ratio data for the reference period 2000 to 2015. When viewing datasets, we need to lock down dimensions to obtain data - like applying a filter. To get to a "spreadsheet" style view of the data, you must lock down all but one of the dimensions – the dimension that you leave unlocked will form the columns of the table.
We are interested in the full time series of data, so select the measure type – ratio, by clicking on it. Doing so will lock down that particular dimension, whilst leaving the reference period free.
This will generate a table with the years as columns, and the reference area (in this case, Scotland) as a row.
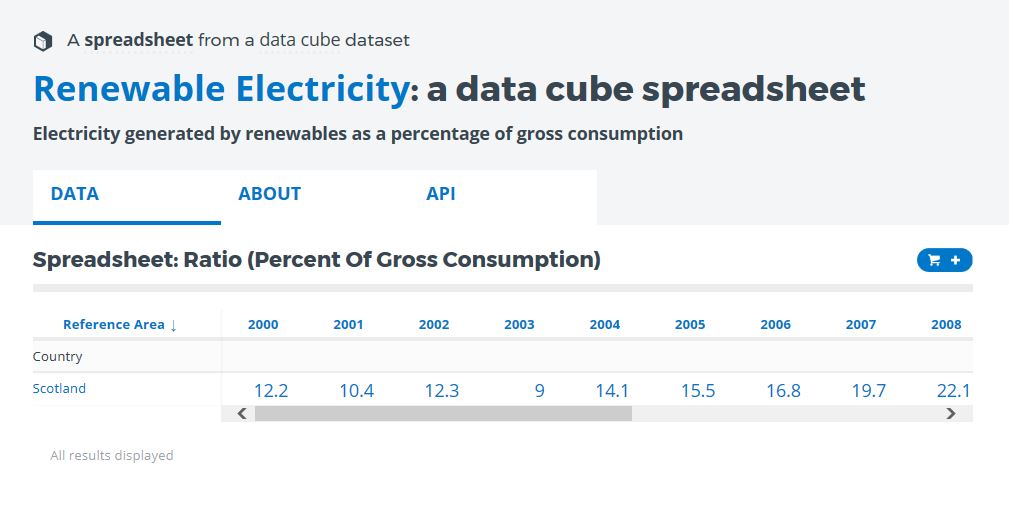
Clicking on a specific value in the table will take you to a page for that single observed value. For example, click on the value 12.2 for year 2000.
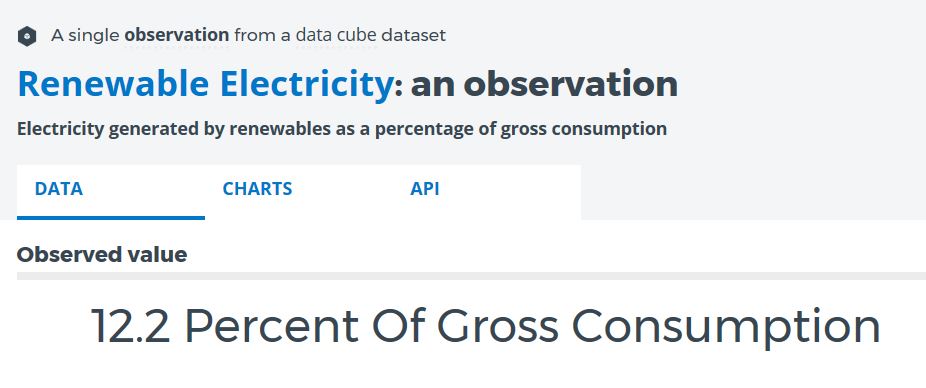
The final step from here is to select the Charts tab.
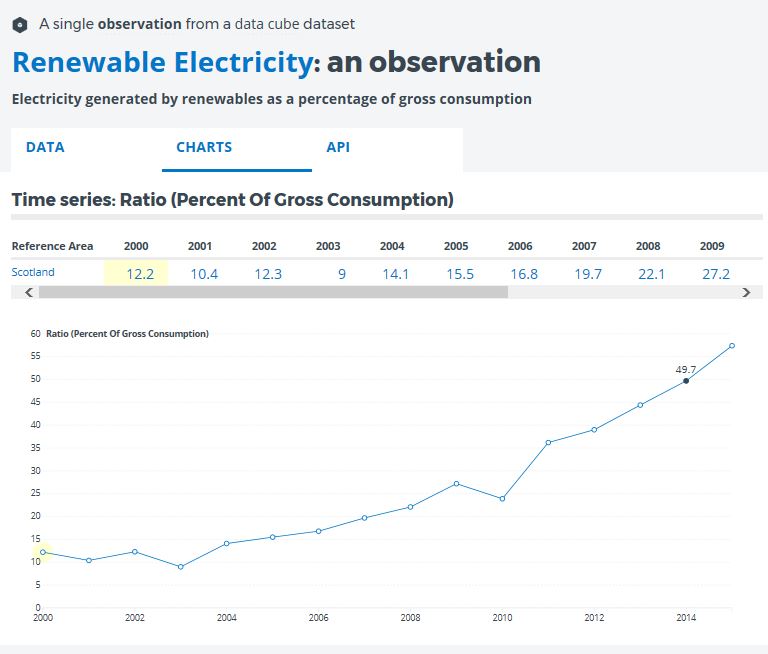
This will bring up the time series chart, showing all values for Scotland, from 2000 to 2015. You can interact with the chart by hovering your mouse over points on the graph, revealing it’s precise value. You can see the data in table format, just above the chart. The hyperlink for this single observation and chart is permanent, so you can bookmark it or share it with colleagues.
For more complex datasets, you can use this method to generate time series charts for other geographies, such as individual council areas, or parliamentary constituencies.
Summary
- Find the dataset that you are interested in using the search tab
- Lock the dimension values, leaving the reference period free
- Click on a value in the table, to go to the single observation page
- Select the Charts tab, and view the time series chart
To continue exploring our datasets, return to statistics.gov.scot