To continue exploring our datasets, return to statistics.gov.scot
A regular request we get from users is how to find and extract data for multiple areas at once. For example, you might want to compare the proportion of homes in different council tax bands across several areas. You can use the data cart function on site to do this.
In simple terms, the data cart allows you to select which areas and data you are interested in. When you save the data cart it will give you a spreadsheet with the data you have asked for if it exists on the site.
For example, let's compare the number of dwellings in different council tax bands within a few areas in Glasgow. We'll use the postcodes G42 8YY, G42 8BU, and G42 7RX, but as we don’t hold data at postcode level we'll need to use the Data Zone type of geography.
Please refer to our guide on searching for a postcode if you need help finding the 2011 Data Zones for these postcodes.
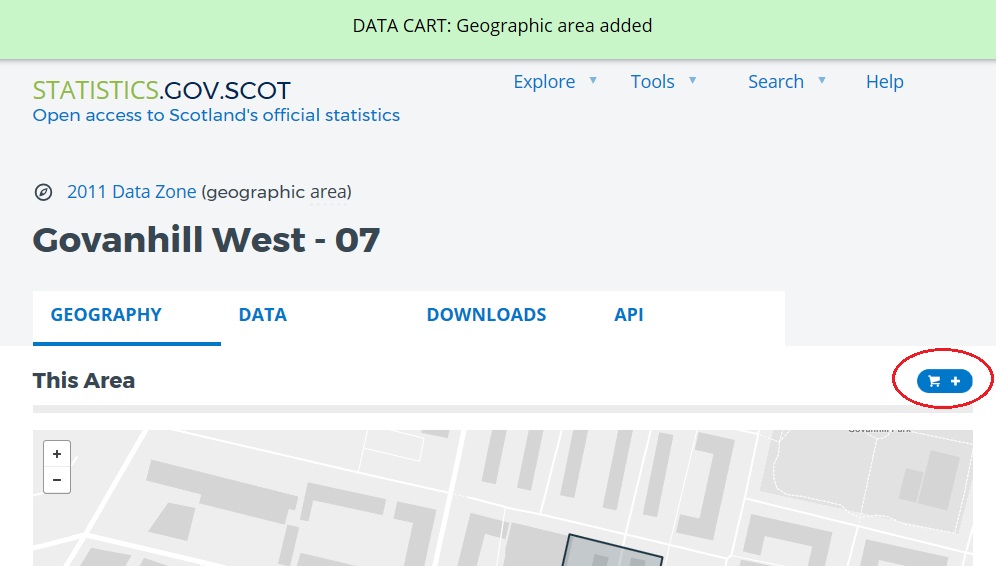
To begin, search for the first postcode, G42 8YY, using the process in the guide and select the 2011 Data Zone. From the Geography tab of the Data Zone, click the shopping cart icon above the map to add the Data Zone to your cart. You should get a confirmation message as seen below.
Repeat this process for the other two Data Zones. At the bottom of the screen you should see "Your data cart contains 0 slices of data and 3 geographical areas", once you have added all 3.
Now that there are areas (Data Zones in this case) in your cart, you need to add data to the cart. Make sure you are still on the Data Zone page, click on the 'Data' tab, then scroll to the bottom of the page and select the "Dwellings by Council Tax Band" data set – if it is not immediately visible, click on the 'Load more rows' button to expand the list. This list of datasets shows all the data available at your chosen geography level.
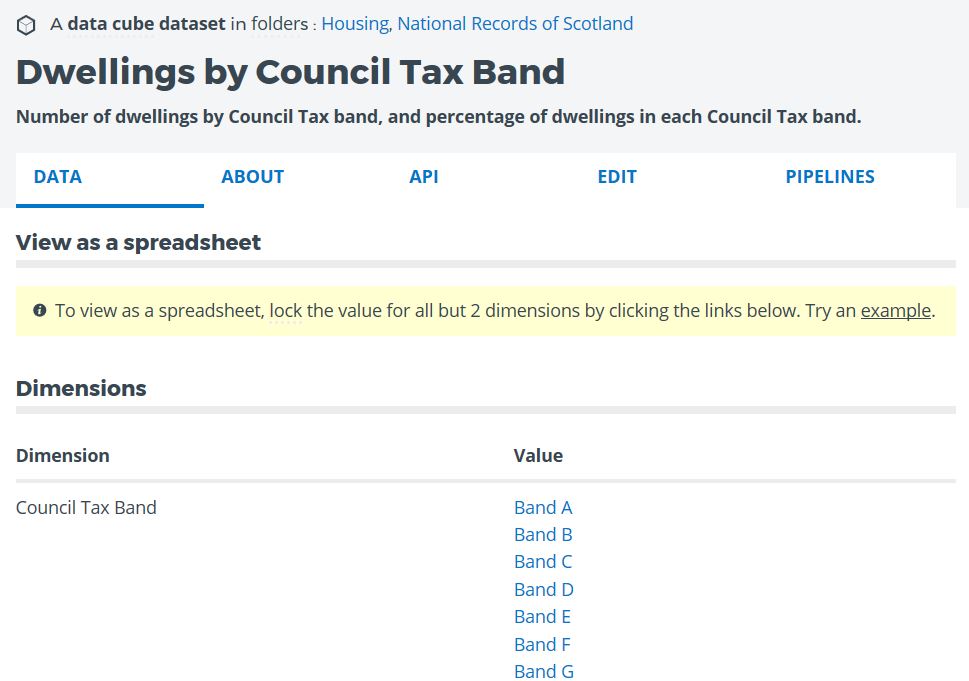
You will then be presented with a page about the Dwellings by Council Tax Band dataset, showing the dimensions of the dataset.
The current screen tells us what data is available in the dataset. We need to start locking down the dimensions to obtain actual data - like applying a filter. To get to a "spreadsheet" style view of the data, you must lock down all but one of the dimensions – if you leave the Council Tax Band unlocked then you will get a table showing all council tax bands.
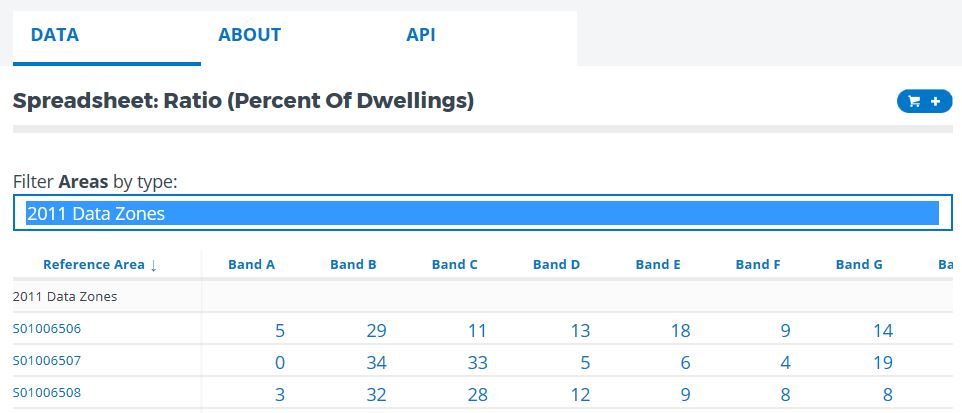
We are interested in the most up to date year, so let's select the "2015" value in the Reference Period dimension. A small padlock icon will appear next to each dimension you successfully lock down. Then, select "Ratio" in the Measure Type dimension. A spreadsheet style view will appear.
We are interested in Data Zone level data, so from the filter areas by type drop down menu, select "2011 Data Zones".
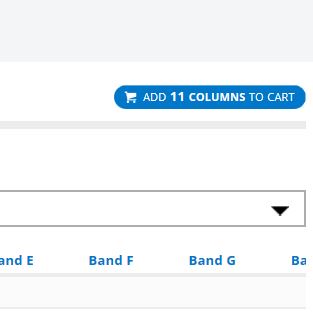
In this example we are interested in all council tax bands, so click on the shopping cart icon above the table to add all the columns to your cart.
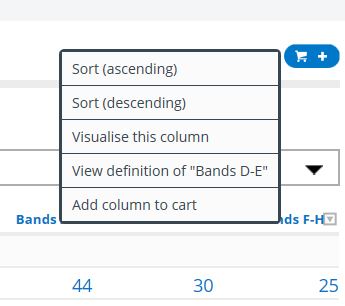
If you were only interested in specific council tax bands, you could click the column headers and then click 'Add column to cart', as shown below.
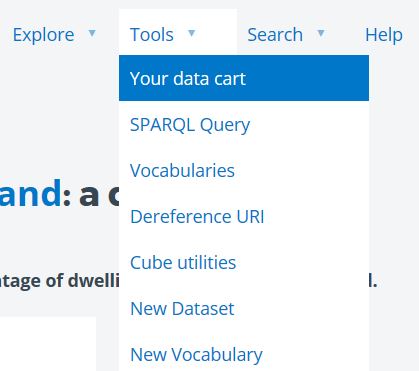
At the top of the screen, hover over the tools menu and click data cart.
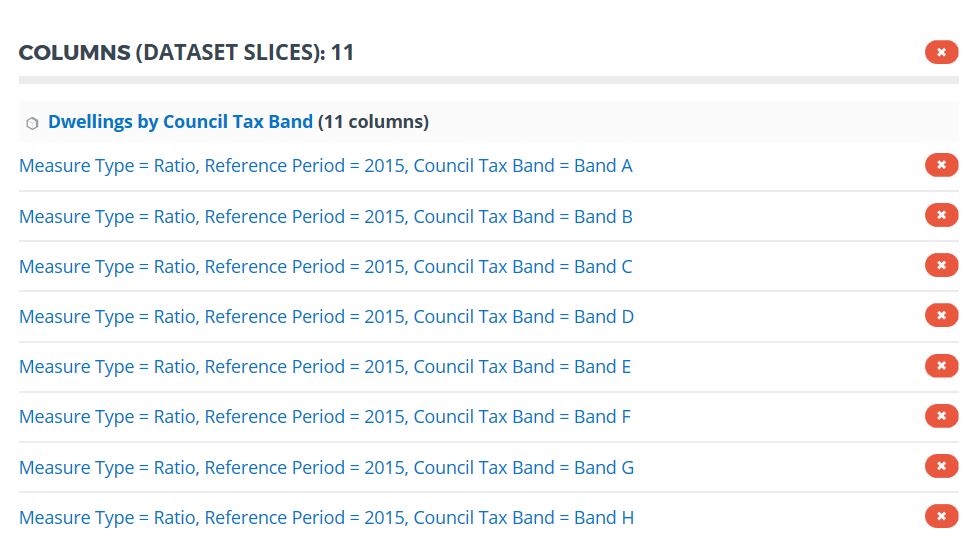
A screen showing what you have added to your cart (in this case, 11 columns of data and 3 data zones) will then be displayed.
Click "Save Cart" to save the data cart.
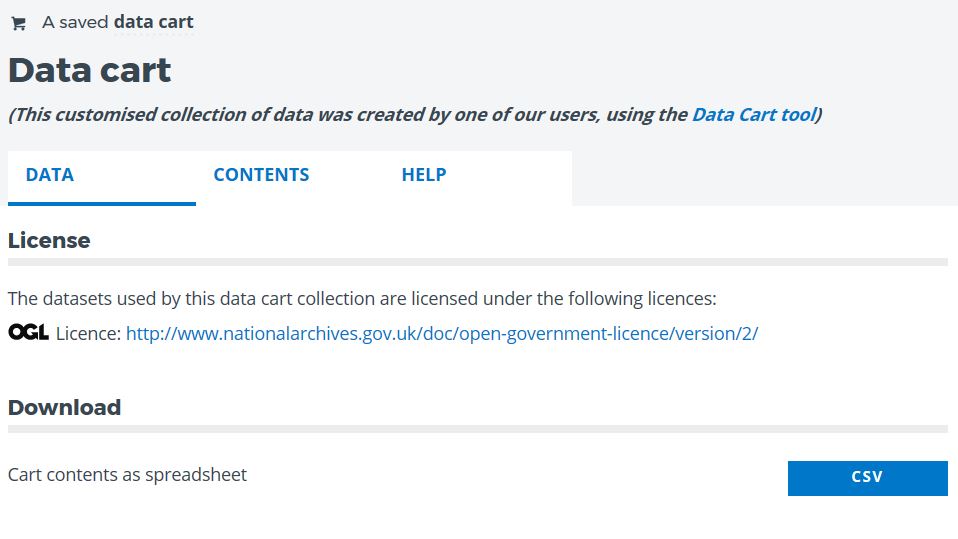
On the screen which appears you will be able to download the contents of your cart by clicking the 'CSV' button.
The hyperlink created for this cart is a permanent link; so you can save this and access the cart again in future.
You can add as many geographies and data sets to the cart as you like using the process above. You can save carts and use them as the building block for future analysis. For example, if you regularly use the same 10 Data Zones you could save this as a geography-only cart and then add the relevant data that you are interested in at a later time.
For data to exist in the data cart download it must exist on the website, so if there are blank spots it is possible that the data is missing from the site, or does not exist at the level you have asked for. You can check the availability of data at the bottom of the data set home page, where a list of available geography types is provided.
SUMMARY
- Find the geographies you are interested in using the search tab.
- Add them to your data cart.
- Find datasets, and fix dimension values to get to the spreadsheet view you are interested in.
- Add columns of data to your cart.
- Repeat steps 1-4 as many times as necessary.
- Go to Tools -> Data cart -> Save cart -> CSV to download the output.
To continue exploring our datasets, return to statistics.gov.scot

