To continue exploring our datasets, return to statistics.gov.scot
We get requests from users on data visualisation, particularly wanting to view data on a map. For example, you might want to compare average house prices between council areas at a glance.
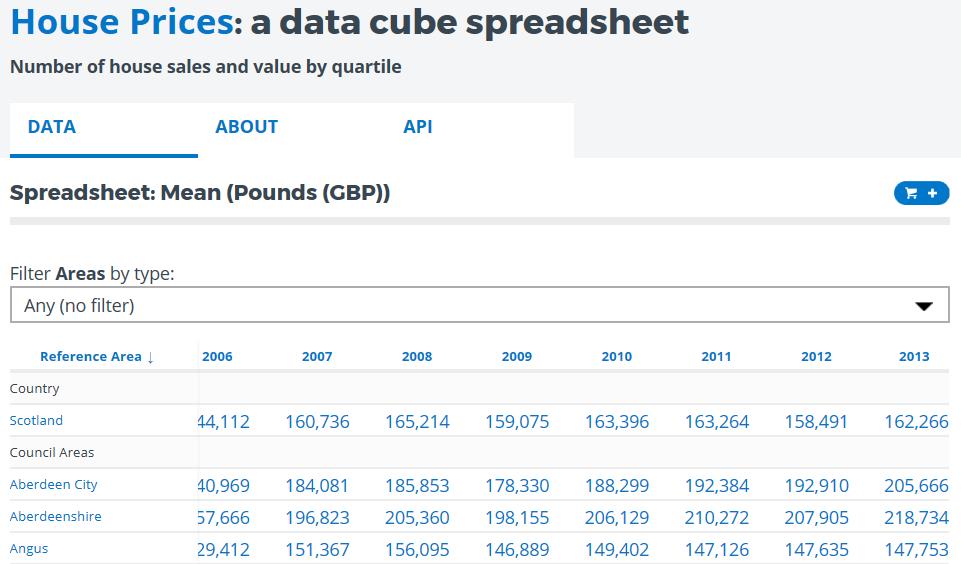
Let’s work through this as an example. First of all, search for “House Prices” in the search tab and select the House Prices data set.
From here, lock down the “Mean” measure type and a spreadsheet view will appear. (A more in depth guide to selecting the data you want is available in our data cart guide)
Use the scroll bar at the bottom of the table to scroll as far as possible to the right, which shows the most recent year data is available for. In this case it is 2013.
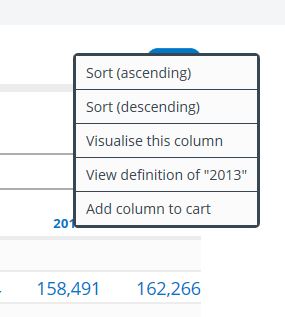
==Click the column header for 2013,==and a small drop down menu will appear. On the drop down menu, click “visualise this column” and you will be taken to a map of the data.
This will take you to page which resembles the screenshot below.
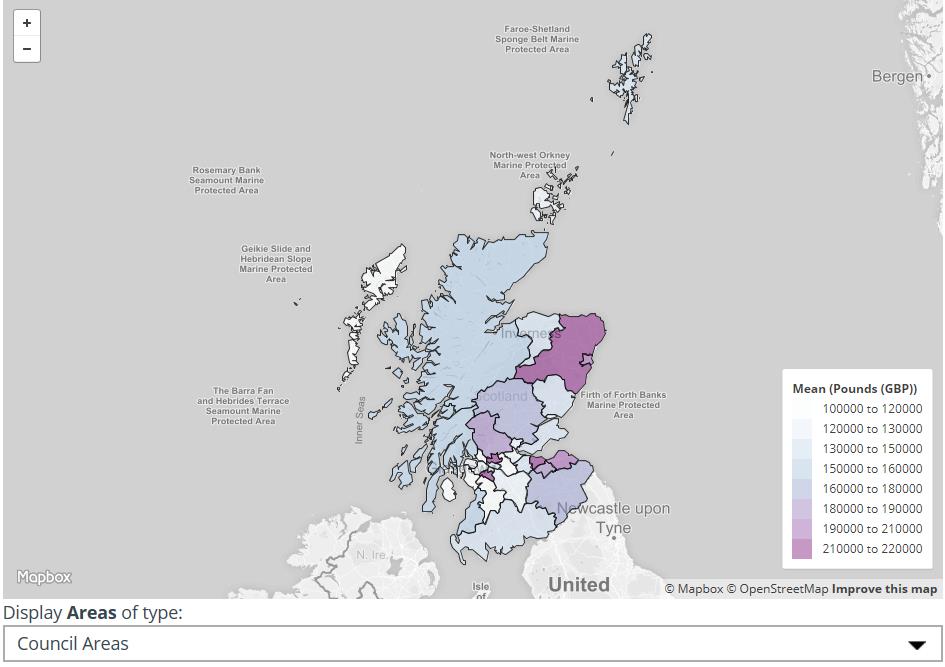
On this page:
• The data is sorted into coloured groups, with each containing roughly the same number of observations. The key on the right shows the range of values found within each group.
• You can change the map to show a different type of geography using the drop down menu below the map.
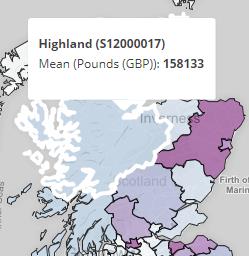
• If you hover over an area on the map, the name of the geography, standard geography code and observed value will appear.
If you would like to create your own maps, The Scottish Government publishes shapefiles for statistical and human health and safety geographies, available at the links below:
We are currently working on a map-based selection tool so you can add geographies to the data cart by selecting them from the map, rather than searching for them manually. We hope to release this with the next set of enhancements to the site.
SUMMARY
-
Find the data set you are interested in using the search tab.
-
Select the dimensions of the data you are interested in to obtain a spreadsheet view.
-
Click column header -> visualise this column.
To continue exploring our datasets, return to statistics.gov.scot